ge.profile — Layered ground model
The ge.profile module is the connective tissue between lab tests,
site investigation, and engineering design. A Soil dataclass holds
one homogeneous layer's properties; a SoilProfile stacks them with
an optional water table and integrates the unit weights downward to
produce total, pore, and effective stress at any depth.
Quick example
import geoeq as ge

clay = ge.Soil("Soft Clay", gamma=17, gamma_sat=18.5,
               phi=0, c=25, e=0.9, Cc=0.27)
sand = ge.Soil("Dense Sand", gamma=19, gamma_sat=20.5, phi=35)

p = ge.SoilProfile([
    (0, 2,  ge.Soil("Fill", gamma=18)),
    (2, 8,  clay),
    (8, 20, sand),
], water_table=1.5)

p.stress_at(10)
# {'sigma': 188.0, 'u': 78.48, 'sigma_eff': 109.52}

p.layer_at(5).name              # 'Soft Clay'
p.total_stress([2, 5, 10])      # vectorised
p.plot(dz=0.1)                  # publication-quality figure
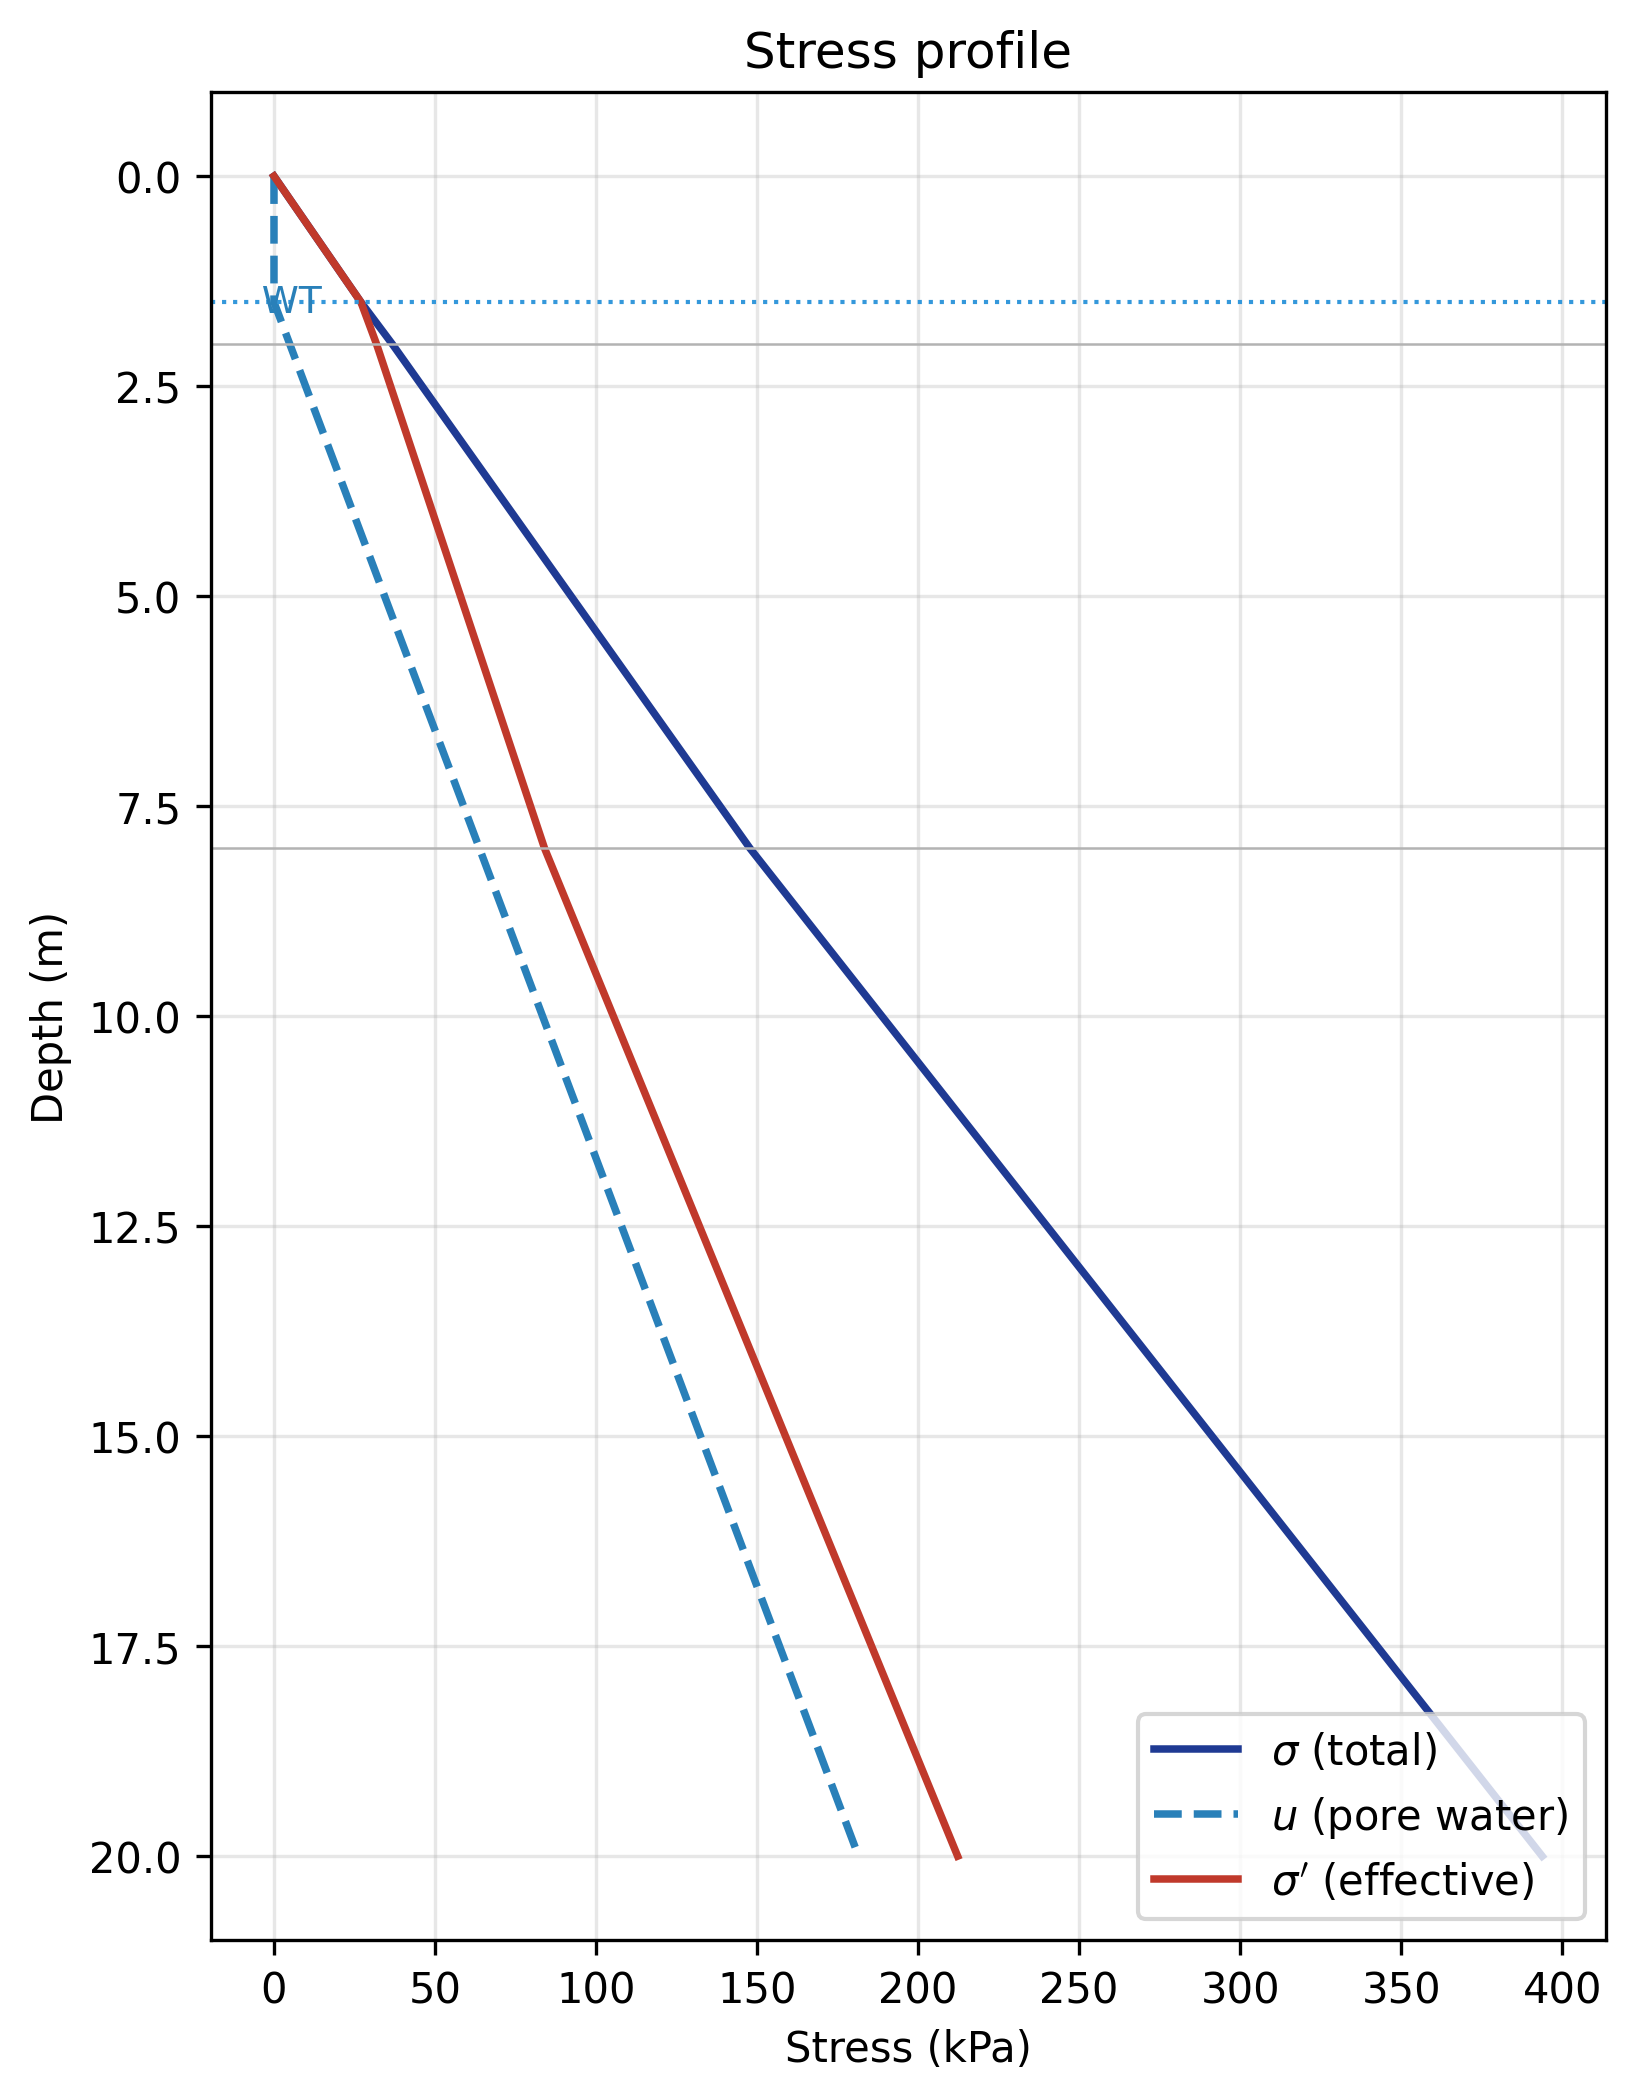
SoilProfile.plot().Stress conventions (Das 2010 Ch. 5)
For a depth \(z\) in a layered profile with the water table at \(z_w\):
GeoEq uses \(\gamma_i = \gamma_{\text{bulk}}\) above the water table and \(\gamma_i = \gamma_{\text{sat}}\) below it. Effective stress is Terzaghi's principle.
The Soil dataclass
A Soil carries the engineering properties of one layer. Only name
is required; everything else has sensible defaults:
| Field | Default | Meaning |
|---|---|---|
gamma |
18.0 | Bulk unit weight above WT (kN/m³) |
gamma_sat |
gamma + 1.5 | Saturated unit weight below WT |
phi |
30 | Effective friction angle (°) |
c |
0 | Effective cohesion (kPa) |
e |
None | Void ratio |
Gs |
2.70 | Specific gravity of solids |
Cc, Cr, OCR |
None, None, 1.0 | Consolidation parameters |
Su |
None | Undrained shear strength |
Es, mu |
None, 0.30 | Elastic modulus and Poisson ratio |
k |
None | Hydraulic conductivity (m/s) |
A helper method returns the effective unit weight:
Common operations
# Build a calculation grid at 0.5 m spacing
grid = ge.mesh(p, dz=0.5)

# Export to a pandas DataFrame
df = p.to_dataframe()

# Iterate over layers
for top, bot, soil in p:
    print(f"{soil.name}: {top}–{bot} m, gamma={soil.gamma}")

# Multi-borehole log plot
ge.log_plot({"BH1": p, "BH2": other_profile})
API reference
dataclass
Soil(name: str = 'Soil', gamma: float = 18.0, gamma_sat: Optional[float] = None, phi: float = 30.0, c: float = 0.0, e: Optional[float] = None, Gs: float = 2.7, k: Optional[float] = None, Es: Optional[float] = None, mu: float = 0.3, Cc: Optional[float] = None, Cr: Optional[float] = None, OCR: float = 1.0, Su: Optional[float] = None, description: str = '')
A single soil layer's engineering properties.
Examples:
>>> from geoeq.profile import Soil
>>> clay = Soil("Soft Clay", gamma=17, gamma_sat=18.5, phi=0, c=25, e=0.9)
>>> clay.name
'Soft Clay'
Submerged (buoyant) unit weight gamma' = gamma_sat - gamma_w.
Layered soil profile with stress computations and plotting.
| PARAMETER | DESCRIPTION |
|---|---|
layers
|
Layers in order of increasing depth. Layers must be contiguous and non-overlapping. Tops and bottoms in metres.
TYPE:
|
water_table
|
Depth of the phreatic surface (m, positive downward).
TYPE:
|
Examples:
>>> from geoeq.profile import Soil, SoilProfile
>>> p = SoilProfile([
...     (0, 2, Soil("Fill",       gamma=18)),
...     (2, 8, Soil("Soft Clay",  gamma=17, gamma_sat=18.5)),
...     (8, 20, Soil("Dense Sand", gamma=19, gamma_sat=20.5)),
... ], water_table=2.0)
>>> round(p.effective_stress(10), 1)
133.7
Source code in geoeq/profile/profile.py
Return the Soil instance at depth z (m).
Source code in geoeq/profile/profile.py
Append a layer at the bottom of the profile.
Source code in geoeq/profile/profile.py
Total vertical stress sigma_v at depth z (kPa).
Notes
Integrates gamma above water table and gamma_sat below.
If the water table is above the ground surface, hydrostatic
pressure of the standing water is added.
Source code in geoeq/profile/profile.py
Hydrostatic pore water pressure u at depth z (kPa).
Source code in geoeq/profile/profile.py
Effective vertical stress sigma'_v = sigma_v - u (kPa).
Return {'sigma': ..., 'u': ..., 'sigma_eff': ...} at depth z.
Source code in geoeq/profile/profile.py
Export layer data to a pandas DataFrame (if pandas is installed).
Source code in geoeq/profile/profile.py
Plot sigma, u, sigma' vs depth.
Returns the Matplotlib figure for further customization.
Source code in geoeq/profile/profile.py
Calculation grid of depths from profile top to bottom at spacing dz.
Source code in geoeq/profile/profile.py
Multi-borehole log plot.
| PARAMETER | DESCRIPTION |
|---|---|
boreholes
|
Mapping of borehole label to profile.
TYPE:
|
| RETURNS | DESCRIPTION |
|---|---|
Figure
|
|